Explore project portfolio reports, aligning goals, data collection, automated reporting, and portfolio optimization for effective project portfolio management.
The almighty project portfolio report
The so-called project portfolio report is essential to project portfolio management (PPM). In this article, however, we will not investigate what constitutes a suitable project portfolio reporting cycle – although it is probably the most critical aspect of carrying out PPM successfully – but we will look closer at the report itself. This article is for Project Management Office (PMO) members interested in questions such as: What should a good report include? What data is needed? Does a single report suffice for all stakeholders? What are good examples of reports? And much more. Loads of things to cover. Let's get started.
Project Portfolio Reporting Cycle vs. Project Portfolio Report
If you are new to the PPM universe, both the project portfolio report and reporting cycle sound similar. The distinction is, however, as crucial as it is simple. Creating and managing the cycle means bringing together all necessary stakeholders regularly to discuss portfolio progress, risk, next steps, and so on. The cycle describes the process. The who, when and what. The report is the artefact – and often a physical document, dashboard, presentation or similar. Both the report and cycle are vital aspects and two of the many jobs the Project Management Office (PMO) is responsible for. If you are interested in what makes a suitable project portfolio reporting cycle, you may want to consider this article.
Align goals and keep the report stakeholder specific
A suitable report is stakeholder-specific and highlights the essential aspects necessary for each stakeholder to act. Yet this very action should be targeted at your goals. That is on the strategic goals you follow with your project portfolio. In the first step, you should align your reporting goals with your strategic objectives. This probably sounds very generic – but it should become clear once you involve your stakeholders in that line of thought. Let's look at a few prominent stakeholder groups to drive this point home:
C-Level & Upper Management: Lacking involvement from these stakeholders is one of the major reasons for the failure of business transformation and strategy execution. Creating a report that allows for easy involvement is hence of utter importance. A key in this ambition is to provide a document that allows for high-level decisions and action – such as managing strategic goals, identifying and mitigating risk, allocating budget, assigning priority, and allocating resources.
Project Managers: Project managers tend to be less involved in portfolio decisions. Your goal is, however, to allow for both portfolio decisions and decisions on the project level simultaneously. You need to know if the project is on time, on budget, or at risk – and if so, what needs to be done to mitigate the latter. The needed level of detail is pretty high and the basis for all aggregation. The project manager is interested in providing you with this information with as little hustle as possible. Their job is to execute the project – and oftentimes, reporting is seen as a nuisance instead of a valuable effort in this endeavor. Hence, your goal is further to provide a reporting infrastructure that offers little resistance.
Finance: If the finance department is involved in your PPM (by the way, it really should be), the goal is to provide the necessary information to gauge financial needs – and often overlooked – the basis for measuring project and project portfolio impact. Impact on the financial statements, that is. This task can be extremely difficult, but it is needed to gauge the project portfolio's health and make informed portfolio decisions.
At this point, it is already clear: you very likely need more than one report to pull this off.
Keep the data collection process in mind
Depending on your stakeholder group, you need a different set of data to create your reports. However, around 90% or more of all demands are met with a set of major data categories:
Descriptives: Data – often text – simply describing the project, responsibilities, sponsor, target, assumptions, and so on.
Mapping coordinates: Data relating each project in the portfolio to strategic goals, organizational aspects (such as legal entity, business unit, and so on), priority, and all else you may think of to pinpoint each project on the portfolio map.
Schedule: Data on responsibilities, tasks, milestones, next steps – and preferably with actual dates on planned, actual, and forecasted progress.
Budget: Data on budget requirements, allocation, and consumption. Preferably in hard currency and on a timeline (often monthly).
Benefit & Effects: Similar to the budget data, but in this instance, data on the actual impact of each project. Again, you will need information on planned, actual, and forecasted effects. In addition, this data set should include pointers as to where finance will be able to measure the actual impact on the financial statements. This data set tends to include information on cost/profit centers, ledgers, and so on.
Resource allocation: If you happen to engage in resource capacity and allocation planning, you need data on resources, capability, capacity and so on, too.
Risk & Status: Data on risk type, risk likelihood, risk impact, risk description, decision needs, and often more general status updates (also commonly plain text).
Stage Gates & Phases: Data on the current and next stage gate or project phase in combination with planned, actual, and forecasted stage gate changes.
Revisions & Modification: This set of data may be less common. But it truly helps to know what data was revised and modified, when – and if possible, by whom.

Try to stay away from spreadsheets for collecting and updating data
Keep in mind that your project portfolio reporting cycle dictates the update frequency of all data points and reports. Bi-weekly and monthly updates are the most common. Make sure that you can pull this off. You can rely on a manual and spreadsheet-driven process for small project portfolios. But already then, it is tedious and extremely error prone and will likely lead to annoyed stakeholders all around. Hence, we highly recommend spending some time choosing and investing in a suitable PPM software solution, such as Falcon.
Create your reports and keep it 80/20 where you can
Before we delve deeper into a couple of examples of some reports, it is paramount to keep not only the data collection process in mind but also the report-creating process. Roughly speaking, there are a couple of ways forward:
Automizing all the way: Automizing is great. It helps you create reports at the click of a button, eradicates errors, keeps administrative work to a minimum, and – maybe most crucial – allows you to keep reports the same at all times. This is great if you want to compare reports over time. But this comes at a cost: Flexibility. You need to be sure that your standardized and highly scalable automated report meets the demand of your specific stakeholder group. By the way, Falcon has a neat little subscription service. It brings the desired report right to your inbox in the time interval you choose. Keep in mind: fully automated reports tend to be great at the project level or even below. It is perfect if you want to report the status quo without diving deeper into explaining it . It seldom comes in handy at higher levels (such as the program or project portfolio level), since this level tends to require an interpretation of the current situation – or explanation to stakeholders less deep into the day-to-day of individual projects of your portfolio.
Automizing charts and tables – analyzing on the spot: This process is like the one described above. However, this process requires the PMO to analyze the provided data, charts, and tables after an automated creation. Although AI (Artificial Intelligence) has come a long way, this process tends to require sitting down, putting your phone on airplane mode, and starting your thinking engine. This process naturally gives you a bit more flexibility but takes more time. But this time is well spent.
Ad-hoc reports and analysis: In an ideal world, you do not need this process type of creating suitable reports. But in the real world, you do. Often, companies and PMOs rely on spreadsheet shenanigans to provide upper management with individual reports and analyses. Be careful when it comes to this process. It should be an add-on – not the standard. Too many times, we have seen processes where the time spent on creating the report eats up all meaningful returns. A good way forward is to integrate your PPM software solution into your business intelligence suite.
The goal is to use automated reports where possible and to keep the process a bit more manual, where and if needed. To bring this about, an 80/20-mindset is helpful. Suppose your automated report does not meet all stakeholder requirements (and in our experience, that is almost impossible). In that case, it is seldom worthwhile spending hours and hours manually every time a report is needed. Try to find the 80%-solution. It often does the job. At the end of the day, you will likely mix all process types described above.
Use a format that fits your needs
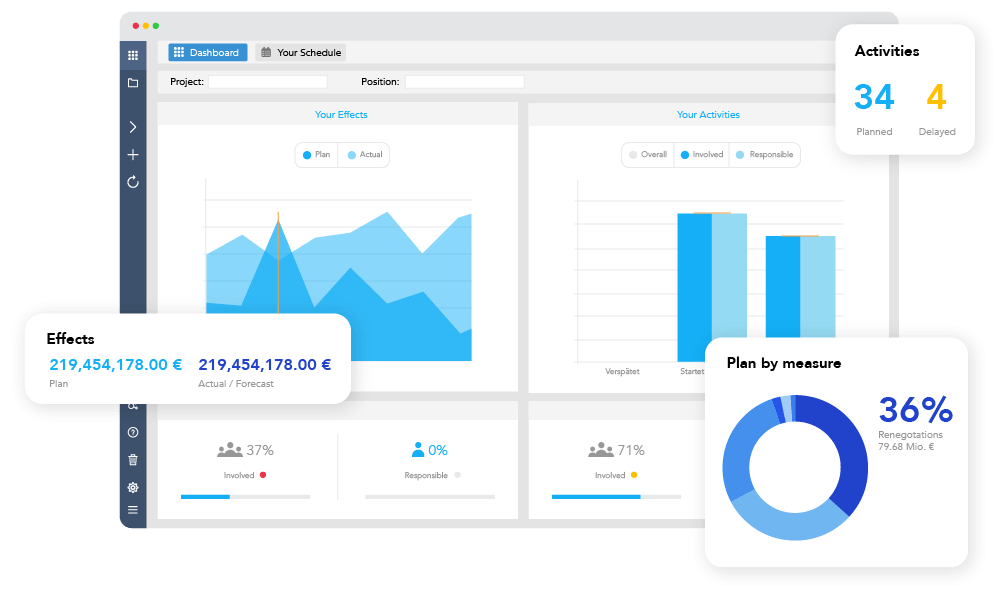
Reports come in many forms and formats. So which is the best for you? The golden standard is still slides – often saved as PDFs. They are naturally not as fun as dashboards and other more interactive versions. Yet they have the strong advantage of being available at a later point in time, too. Plus – and although we do not recommend it for environmental reasons amongst others – you can print them. This sometimes does wonders if you bring your stakeholders together in a room physically. We recommend combining formats: slides and PDF for committee meetings and alike. They provide the standard view. Dashboards, BI suites, and so on are used for more ad hoc analyses. This does not mean that you shouldn't invest time in getting a nice BI solution that integrates nicely with your PPM tech stack. You benefit tremendously from having both.
Report your findings
Now, what should you report? Truth be told, that is hard to say. It depends on everything that has been described thus far and more and extends to your organization, its culture, the project types, people and stakeholders, and much more. But maybe a couple of examples will help you.

Examples for automated reports with greater detail - especially for project managers
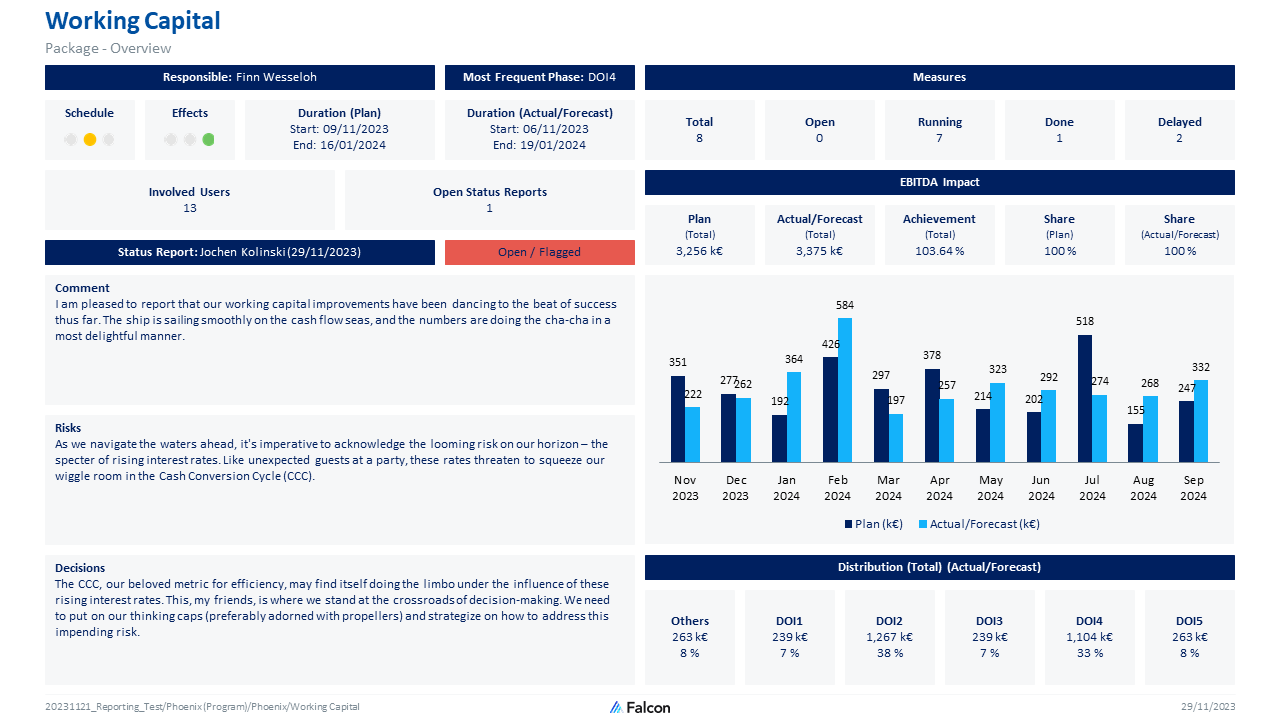
More detailed project portfolio reports offer granular insights into the intricacies of individual projects, offering stakeholders a comprehensive understanding of progress, challenges, and milestones. Given that we are talking about project portfolio reporting, information is commonly still quite aggregated – especially when compared to traditional and very detail-oriented project reports. Frequently, we see two-pager formats. Tables are commonly employed within these reports to organize and present detailed data in a structured format, enhancing readability and comprehension.
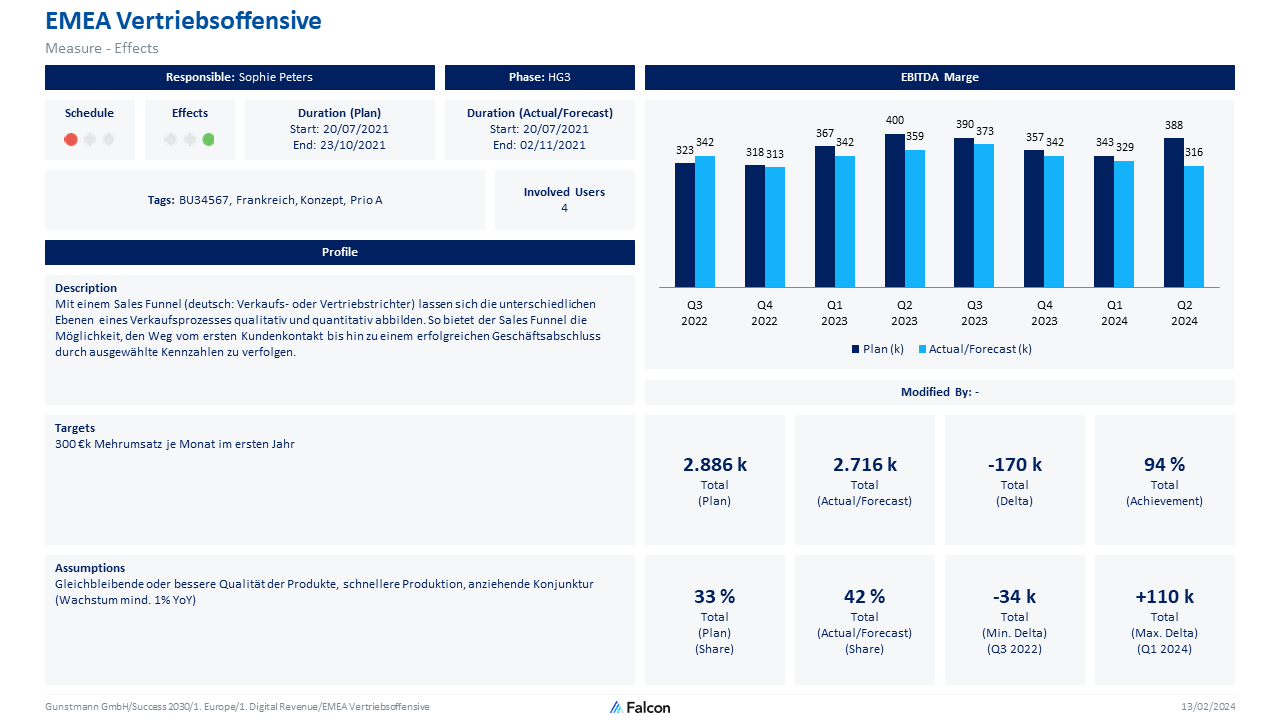
Within these tables, a wealth of information is meticulously documented, encompassing milestone achievements, delays, stage gate progress, budget allocations, and financial impacts. Visual indicators such as traffic lights, bar charts, Gantt although you may want to stay away from them for several reasons, burn-up charts, and much more help to swiftly identify areas of concern or progress, enabling stakeholders to focus their attention where it is most needed.
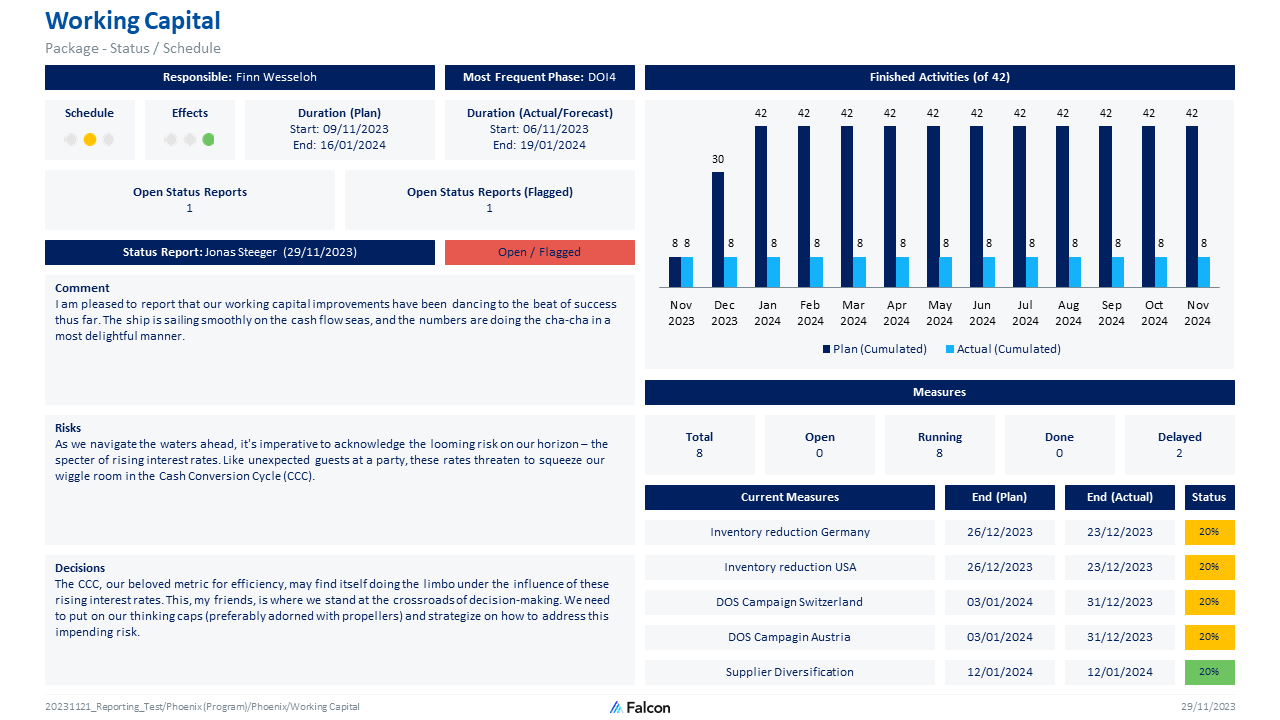
In addition to tabular data, more detailed project reports often incorporate written status reports, providing narrative context and analysis to complement the quantitative data presented. These written summaries offer insights into project strategies, risk management efforts, stakeholder communications, and other qualitative aspects that may not be captured in numerical metrics alone.
Would you like to find out more about project portfolio management?
If you would like to find out more about project portfolio management, we recommend reading our article "Project portfolio management - introduction for all experts, practitioners and interested parties", which examines the topic in more detail.
Examples of automated and aggregated reports for decision-makers and PMOs
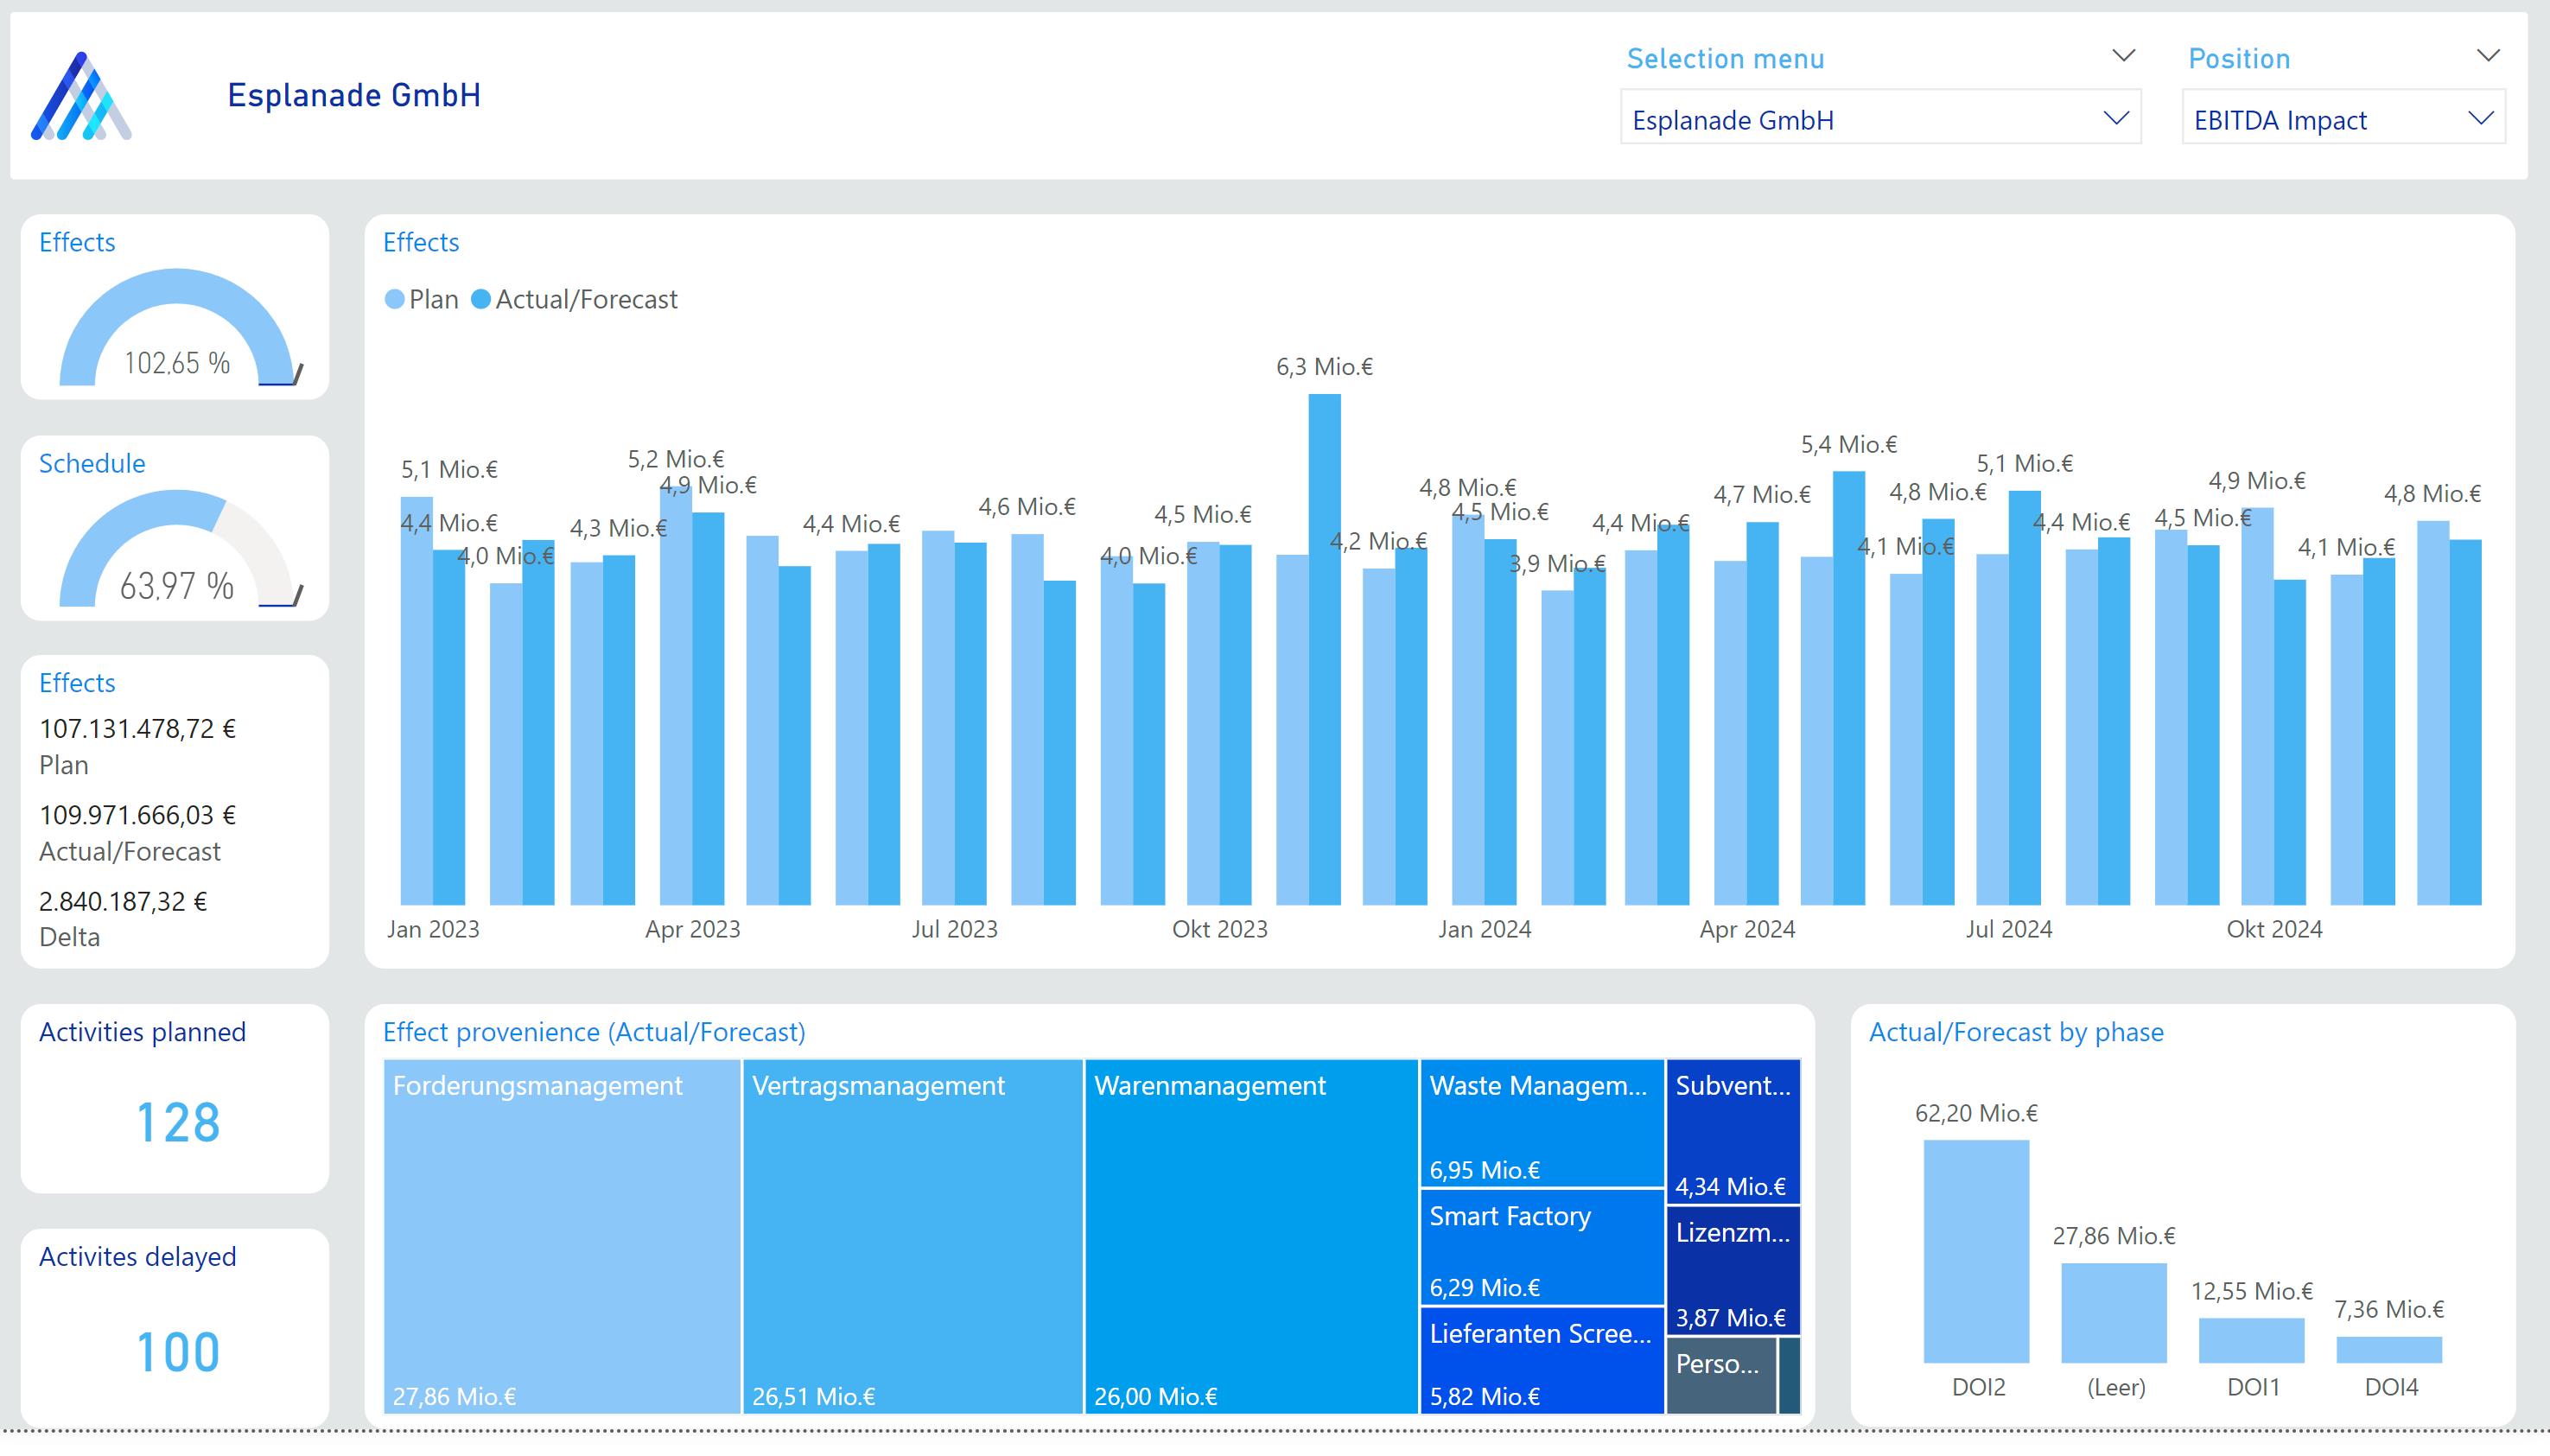
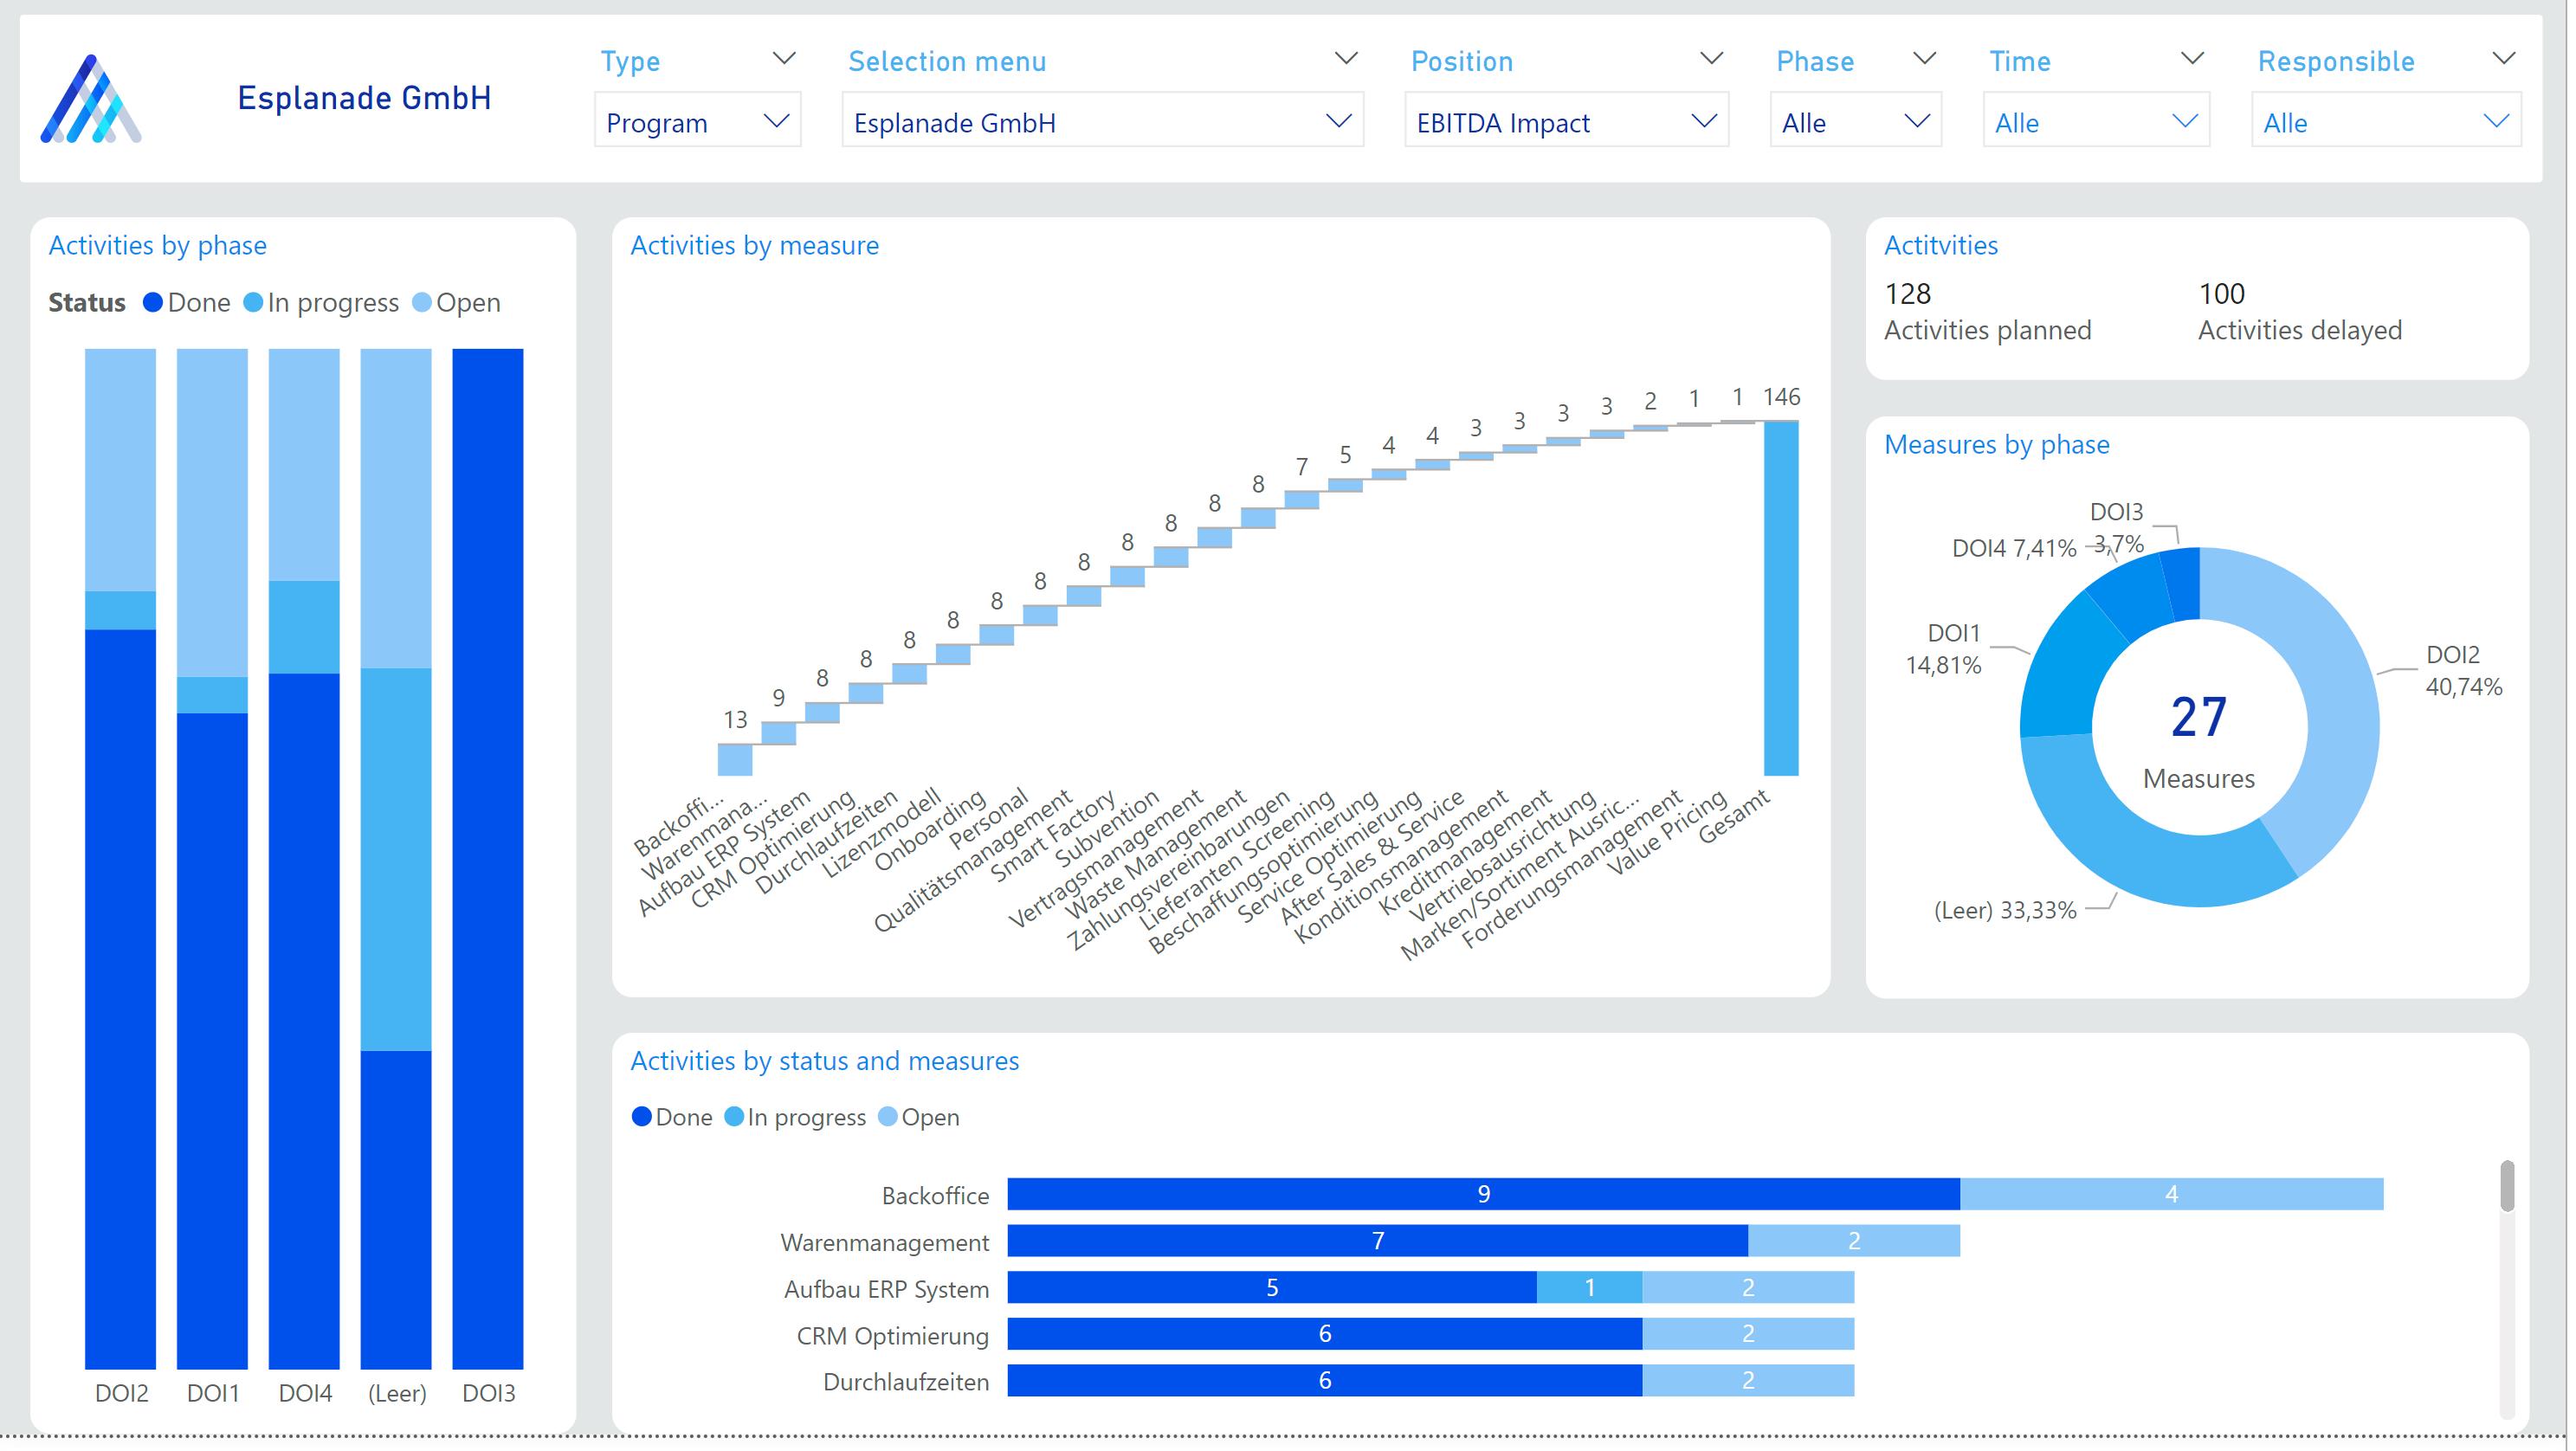
Aggregated project portfolio reports serve as comprehensive snapshots of an organization's various projects, providing vital insights into their progress performance, and alignment with strategic objectives. These reports often employ tables and lists as a primary means of presenting data, offering a structured and easily digestible format for stakeholders. Within these tables, a wealth of information is typically encapsulated, covering essential aspects such as schedule adherence, stage gate achievements, budget allocations, and financial impacts. Each project's status is often indicated through the use of traffic lights or other visual cues, facilitating quick assessments of overall health and potential risks.
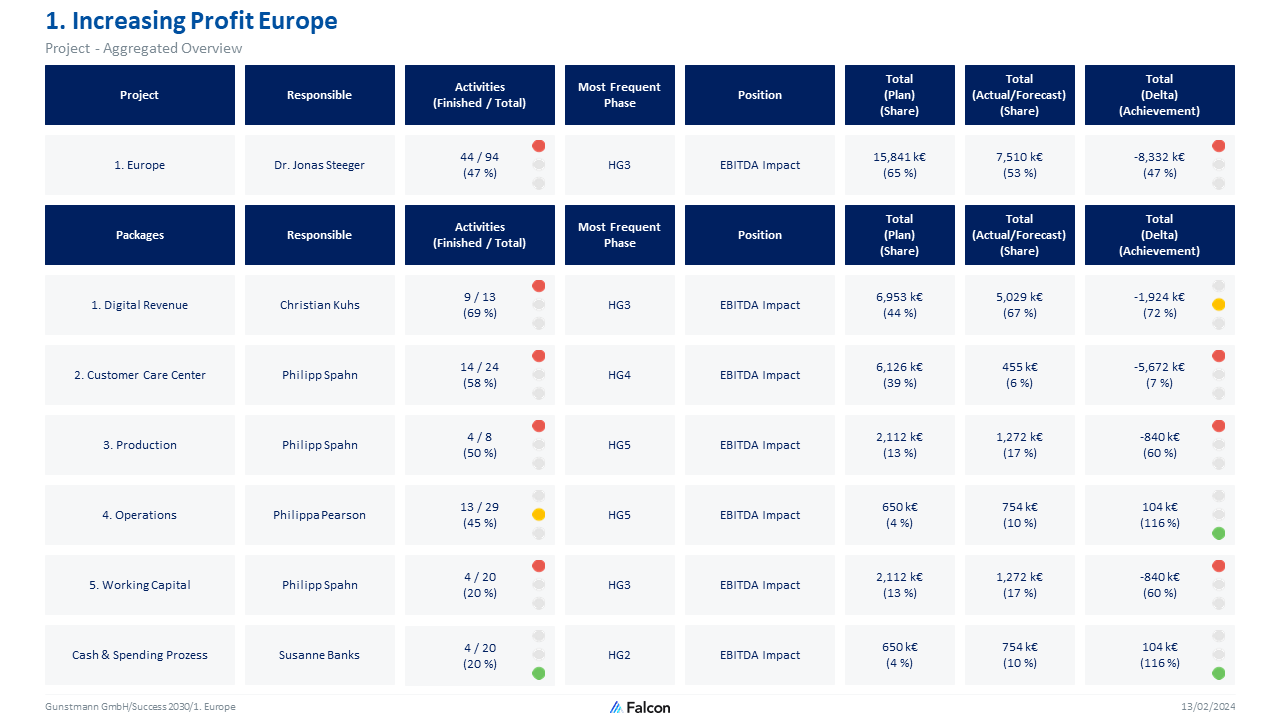
A key to aggregated portfolio reports is the actual aggregation of both data on the project level and at higher levels. By consolidating data from multiple projects into a single report, decision-makers gain a holistic view of the organization's project portfolio. This enables them to identify trends, prioritize resources, and make informed strategic decisions to optimize project outcomes and mitigate potential challenges.
Depending on the size of the project portfolio, you may want to combine very high-level reports with some – still aggregated – reports that allow for going a tiny bit deeper. We recommend one-pagers at this point. They offer that tiny bit more detail and – crucially – should comprise a written statement on the status quo and way forward. This provides you with the possibility to explain the situation and possibly offer ideas on how to mitigate risk, prioritize projects, and allocate resources. In addition, we highly recommend combining your analysis with your stage gate data. It is important to understand the distribution of resources, tasks, and planned and realized budget and effects on your phases and the entire portfolio.
Examples for ad-hoc analyses
Analysis on the project portfolio level encompasses a range of techniques aimed at evaluating the collective performance, risks, and strategic alignment of an organization's projects. Several commonly used methods help stakeholders gain insights and make informed decisions about the portfolio's health and direction.
- Strategic Alignment and Risk Analysis: This analysis assesses how well individual projects align with the organization's overarching goals and objectives. It involves evaluating whether projects contribute to key strategic initiatives and priorities, thereby ensuring that resources are allocated effectively to support the organization's mission and vision.They are often coupled with risk analysis.
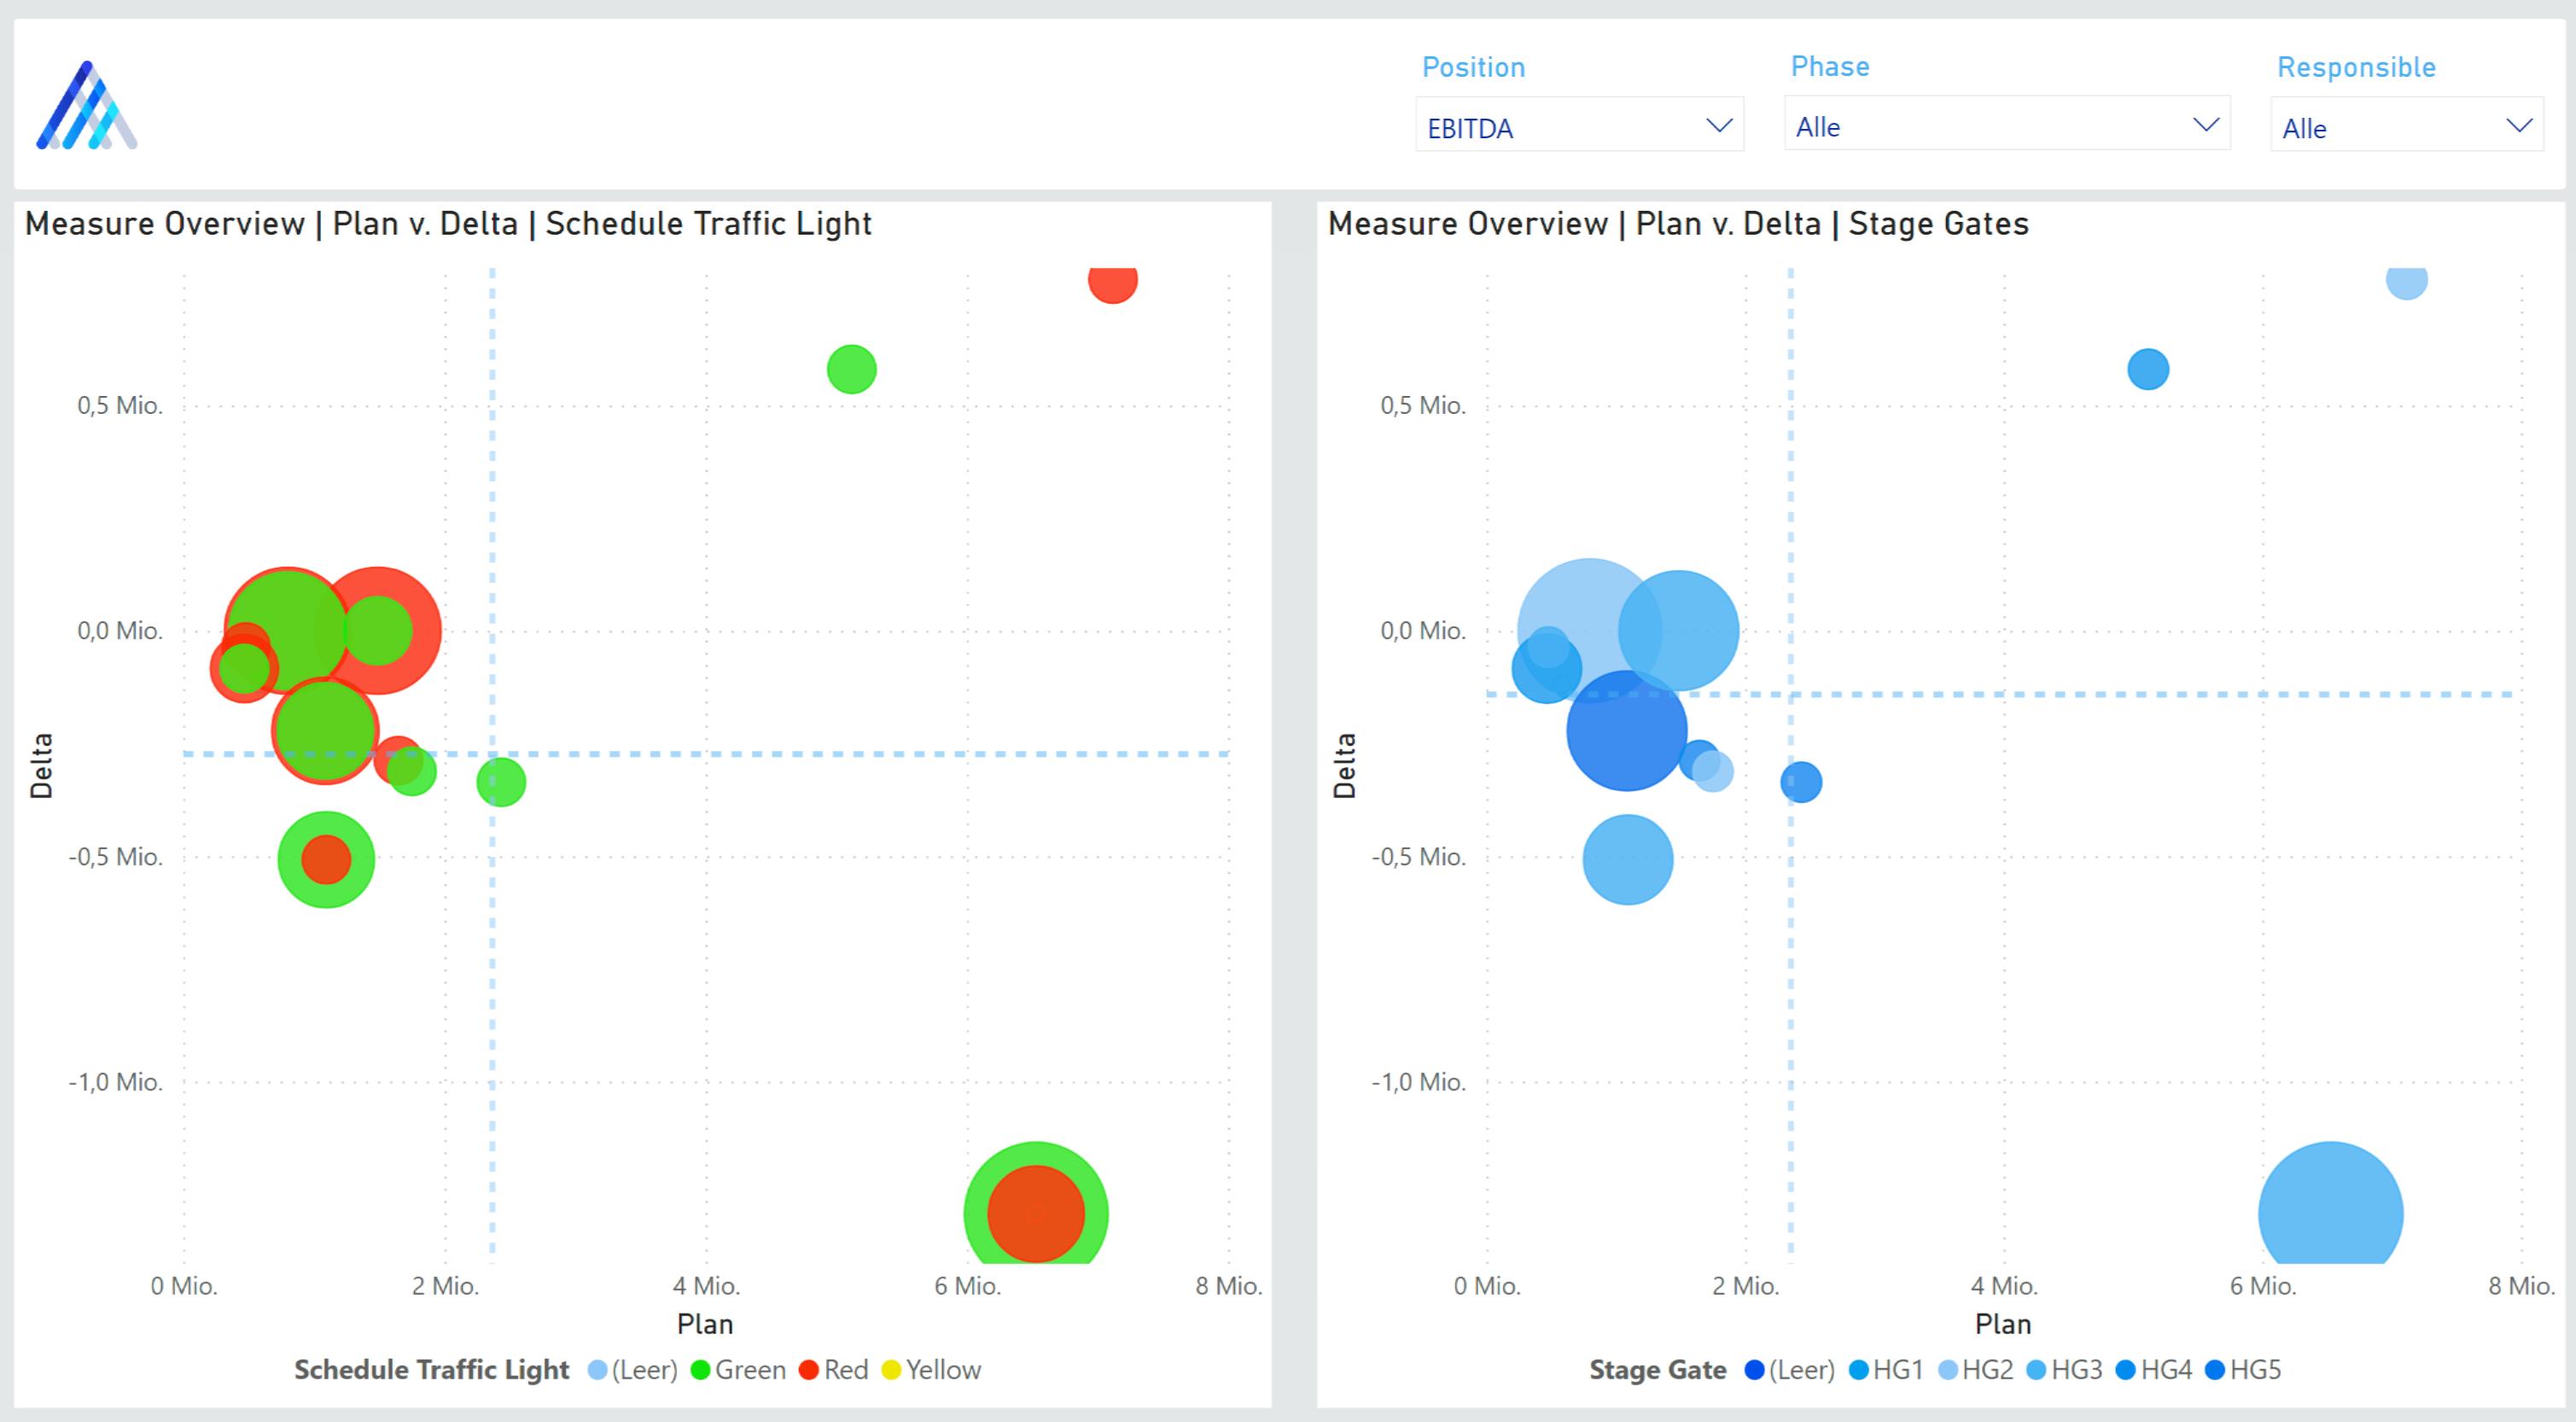
At the portfolio level, this involves identifying, assessing, and mitigating risks that could impact multiple projects simultaneously. It involves evaluating the likelihood and potential impact of various risks on the portfolio's performance and implementing strategies to manage and mitigate them proactively. Commonly used charts are risk-impact bubble charts.
- Resource Allocation Analysis: This analysis involves evaluating resource allocation across the portfolio to ensure optimal utilization of available resources such as finances, personnel, and technology. It helps identify resource bottlenecks, overallocation, or underutilization, enabling stakeholders to reallocate resources strategically to maximize portfolio performance.
- Financial and other KPI analysis: Financial analysis involves evaluating the financial health and performance of projects within the portfolio. It includes assessing budget adherence, cost overruns, return on investment (ROI), profit line impact, and other financial metrics to ensure that projects are delivering value and are financially sustainable.
Engage in project portfolio optimization and communicate results
Remember, we are still talking about PPM, not PM. There is a world of a difference. All reports and analyses are meant to allow for project portfolio optimization. Portfolio optimization involves identifying opportunities to optimize the portfolio by prioritizing projects, reallocating resources, and balancing risk and return. It helps stakeholders make informed decisions about which projects to initiate, continue, or terminate to maximize the portfolio's overall value and alignment with strategic objectives. By leveraging these analysis techniques, organizations can gain deeper insights into their project portfolios, identify opportunities for improvement, and make data-driven decisions to enhance portfolio performance, mitigate risks, and achieve strategic objectives.
A key part of this is also effective stakeholder communication: Effective communication of findings and decisions from regular project portfolio reporting meetings by PMO members to all stakeholders is vital for portfolio success and organizational alignment. This practice ensures transparency, fosters collaboration, and enables informed decision-making across various levels of the organization. By disseminating relevant information promptly, PMO members empower stakeholders to understand project progress, anticipate challenges, and align their actions with strategic objectives. Ultimately, robust communication enhances accountability, builds trust, and strengthens the overall project management framework. A good report, available at all times, helps you with this very crucial task. Falcon offers you that report. Want to try it out?
Do you want to create portfolio reports with a click of a button and integrate your PPM with Power BI seamlessly?
Falcon is the right lightweight PPM software solution for you! We would be happy to tell you in a personal meeting how Falcon and its numerous features can support you in your individual case and save your team lots of time in their PPM work.
Learn more