Data-driven communication is becoming increasingly important in business transformations and implementation management. In transformation and strategy projects, we therefore have always recommended regular project reporting to our customers. The benefits are obvious: a facts and figures-based approach is crucial for companies to efficiently manage projects and make decisions in order to react quickly to risks, adjust the project plan and identify deviations.
Since information overload can often lead to confusion, numerous tools exist to help you with your analytics approaches: Today we would like to introduce you to our Falcon-based reporting approach that will help you make your data reports a breeze.
Our Falcon software has been offering our users structured and simple reporting in PowerPoint format via one-click reporting for some time now. At the push of a button, classic management reports can be created from your data - in a filterable manner and in the corporate identity of your choice. The feedback from our customers on the reporting feature was very clear: Fast reports make the daily work of companies much easier. In order to offer consultants, PMOs, investors and managing directors even more flexible, individual and interactive reporting options, we have now enabled the native connection of Falcon to Microsoft Power BI. The integration is available immediately in the beta version, while we are still working behind the scenes on final optimizations.
You need more guidance when it comes to the report creation? In this article, you will learn why Falcon's Power BI connection is a real game changer for your reporting and how you can manage to integrate all important information - such as your key performance indicators - into a well-structured reporting.

What is Microsoft Power BI?
Power BI is a standardized, scalable platform for business intelligence and provides the option of establishing connections to different data, visualizing them and seamlessly inserting the visualizations into other applications from the Microsoft 365 environment, among others - e.g. Excel, PowerPoint or Teams. Another software solution whose name is more often mentioned in this context is the BI solution Tableau, which can also be used for data visualization purposes.
How can I use Falcon and Power BI together?
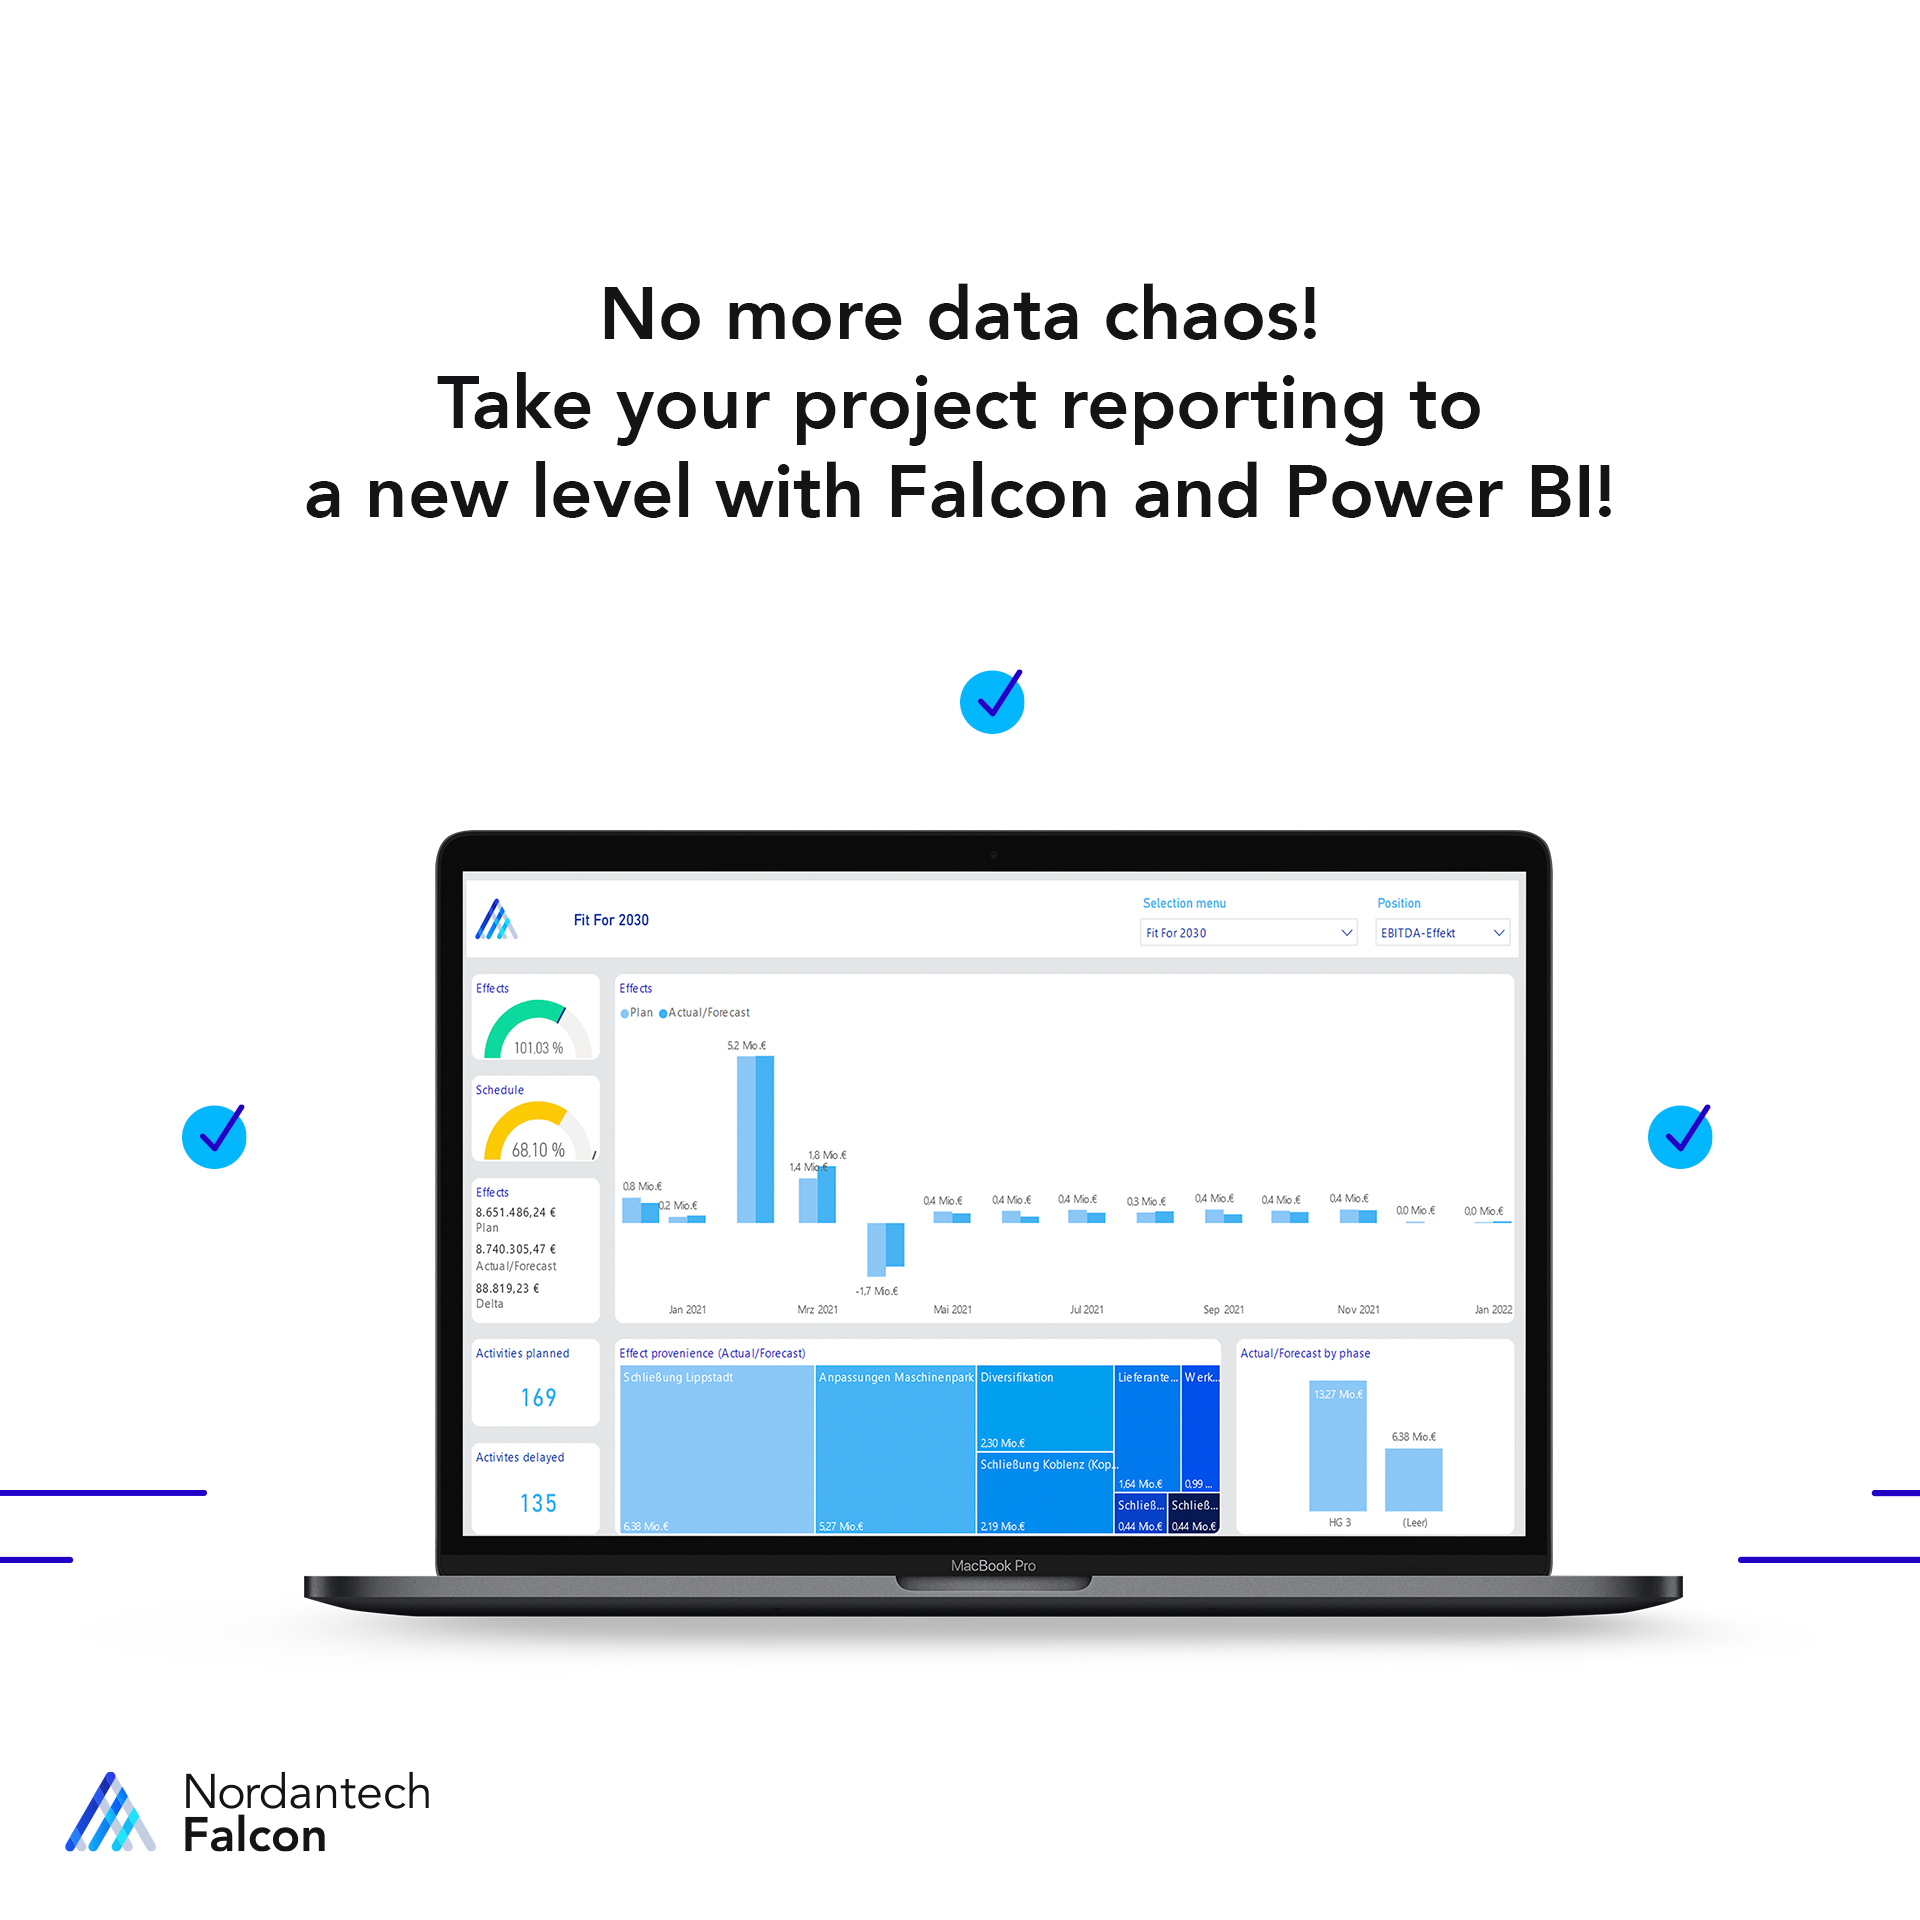
Power BI recognizes countless data sources - and from now on as a native integration also our software Falcon. Falcon can be connected to Power BI in just a few clicks. This means that data from Falcon automatically flows to Power BI and is permanently available there, up-to-date and in real-time - without the need for regular and tedious imports. With the data at hand, you can create individual dashboards and analyses in Power BI according to your taste and CI. The user interface in Power BI is based on the Office 365 suite, such as PowerPoint and Excel, and is therefore very quickly familiar to most users. You can design the dashboards in two view options, either completely fixed or dynamic. Dynamic dashboards can also be filtered live by the viewing user outside of the editor, depending on the intended use and target audience, for example, through built-in dropdown menus. A joy for interactive analysis via tablet or live in a meeting with customers, management or stakeholders.
Would you like to learn more about the cycle and reporting or do you have any questions?
No more chaotic key figures and structureless information! At Nordantech, we create our own pdf resources, full of information concerning interesting topics. In our resource Cycle and Reporting, you will find all necessary information as well as best practice approaches around reporting, reports and cycles.
On the other hand, fixed dashboards offer another decisive advantage because they can be easily integrated into PowerPoint presentations. In addition to the ability to display Power BI dashboards as images in PowerPoint, real-time dashboards can be embedded in PowerPoint, where they are automatically kept up-to-date. With these live reports, time-consuming slide updates before regular meetings are a thing of the past. Our tip: PowerPoint can be synchronized with Power BI in such a way that it exactly matches your CI and business. The different systems are thus indistinguishable and appear as seamless reporting.
5 benefits that Falcon's Power BI connection brings to your reporting:
- real-time analytics: Achieve fast, data-driven decision making with real-time analytics.
- automation: Take your reporting game to a new efficiency level through automation.
- democratization: provide more information, analysis and insights to less analytics-savvy users through dynamic dashboards, and visually prepare your metrics.
- standardization and repeatability: standardize your reporting across projects, clients or investments!
- focus: Focus on the strategic issues of your program or project - Falcon and Power BI create the perfect reporting.
Conclusion:
The integration of Falcon with Microsoft Power BI represents a groundbreaking development in corporate reporting. With real-time analytics, automation capabilities, democratic accessibility to data, standardization and focus on strategic issues, your reporting will reach a new level. This powerful combination of software solutions enables optimal use of data for sound decision-making and improved business development. Organizations can benefit to accelerate their data-driven decision-making, increase efficiency and gain valuable information insights through more visually appealing dashboards. The Falcon and Power BI connectivity promises to streamline internal reporting and helps companies maximize their potential. Do not hesitate to contact us for personal guidance apart from our informative resources - we love to help you with your report and offer a detailed Falcon onboarding program.